To dyke, or not to dyke: A debate coming to a town near you

Finally, President Obama’s state of the union called out Congress’s problem with climate change. Their denial is merely a symptom of overall scientific ignorance, a simply medieval issue that has temporarily stalled many great nations’ progress throughout history. Yet, President Obama’s points about climate change and it’s relevance to the nation gives one hope that there is a small smoldering ember of collaborative-driven leadership buried under piles of Benghazi reports, and it couldn’t come a moment too soon. The USA has stalled its scientific and technological growth at a key time in global history and is already generations behind the modern world in technological advancements to protect its people against a rising threat – the ocean.

Let me present you with a case study. I live in Zeeland in the Netherlands, and this area is protected by the world-famous Oosterschelde surge barrier; a 9km system of dams, movable concrete slabs, and artificial islands.  The Oosterschelde is one of many ocean barriers strategically placed along the Dutch coast and has been deemed one of the Seven Wonders of the Modern World by the American Society of Civil Engineers.  During storm events, the Oosterschelde’s massive concrete slabs shut and cut off Zeeland’s waterways from the surge of the North Sea.

By Nils van der Burg from Madrid, Spain (IMG_7446) [CC BY-SA 2.0 (http://creativecommons.org/licenses/by-sa/2.0)], via Wikimedia Commons

The Oosterschelde Delta Works – 9km long: By Nils van der Burg from Madrid, Spain (IMG_7446) [CC BY-SA 2.0 (http://creativecommons.org/licenses/by-sa/2.0)], via Wikimedia Commons

Read More

#DrownYourTown Coastal States Road Trip is coming to your (virtual) town

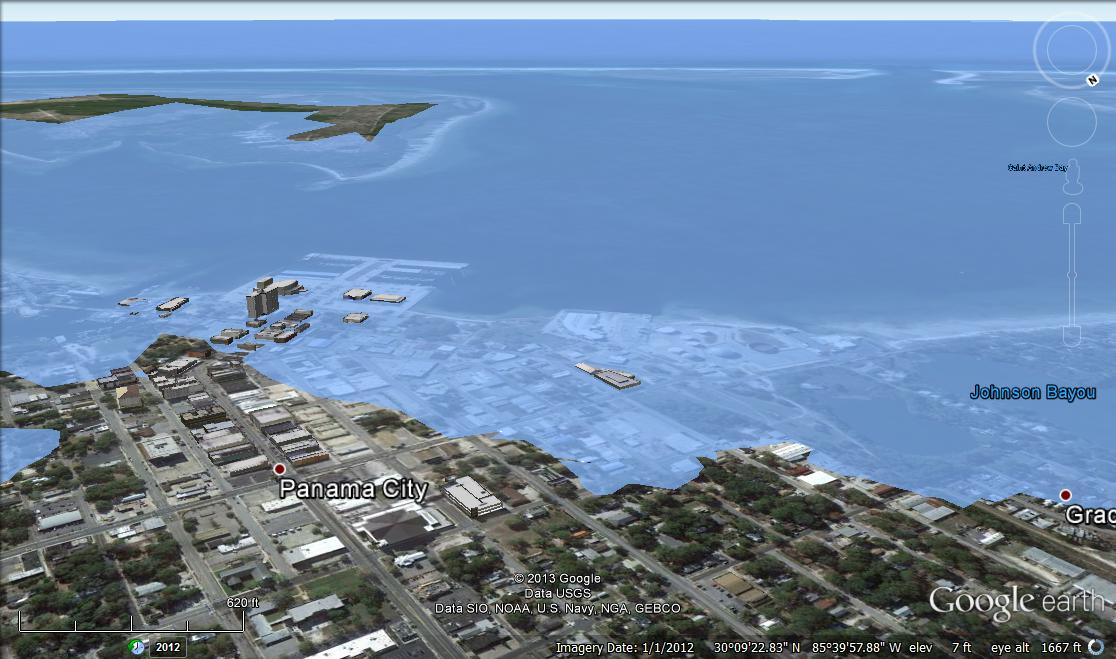
Last week, I kicked off the #DrownYourTown Coastal States Road Trip with a cruise through California. Over the next few weeks, we’ll visit every coastal US state (and territory) and see what they look like after 5 meters of sea level rise. The first week of images is available at the #DrownYourTown tumblr and you can follow along in real time on twitter @DrownYourTown.

Panama City, FL after 5 meters of sea level rise.

Panama City, FL after 5 meters of sea level rise.

Read More

Global is Personal: 4 Lessons About Climate Change Outreach from #DrownYourTown

Almost four months ago, I sat down at my computer with a puzzle to solve: is there an easy way to model sea level rise without using expensive GIS programs. I found that solution in Google Earth and, after a few days of experimenting and tweeking, #DrownYourTown was born.

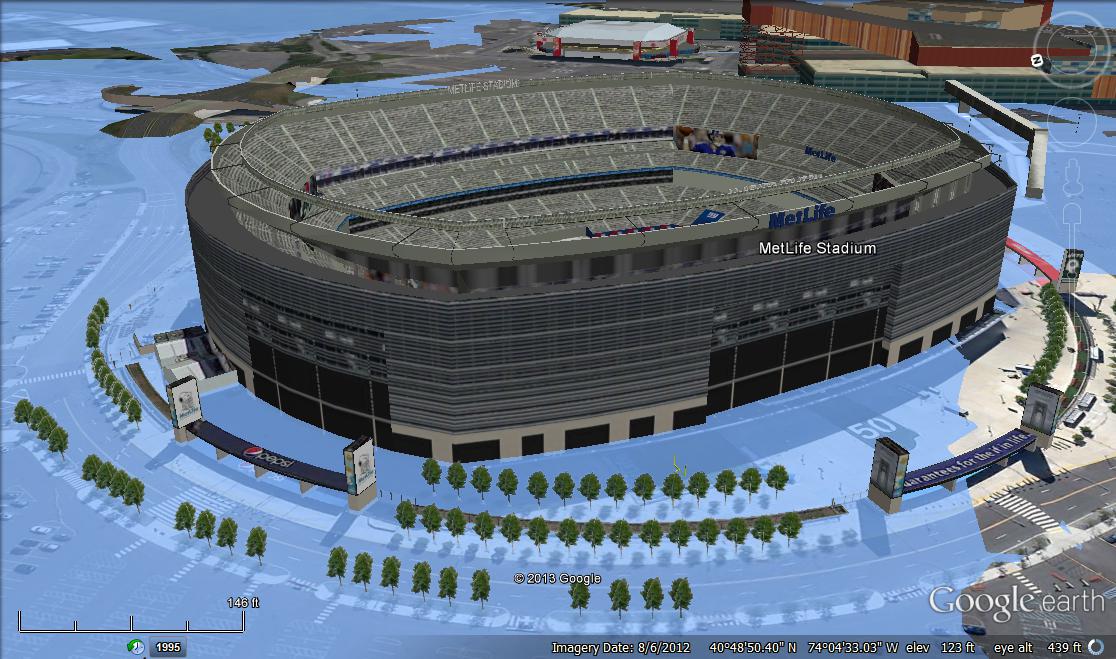
1 meter of sea level rise would make for a very soggy superbowl.

1 meter of sea level rise would make for a very soggy superbowl.

#DrownYourTown is a tool for exploring sea level rise through real-time, interactive, GIS modeling. Anyone can submit a request via twitter or tumblr and receive a custom, 3D model of sea level rise anywhere in the world. The system allows users to produce dramatic visuals of both plausible and implausible climate change scenarios. The project is ongoing, with user generated content, an active tumblog, and a vibrant twitter community centered around the hashtag. I am constantly exploring new ways to reach a broader audience. Currently, #DrownYourTown is on a virtual road trip, visiting a new coastal state each day, and cruising through towns after 5 meters of sea level rise.

#DrownYourTown has been an exciting and sometimes humbling journey. Here are four lessons about climate change outreach I learned from drowning your town.

Read More

Check out my #DrownYourTown feature at Zócalo Public Square

One day, I’ll look back fondly and tell my grandkids about the week I spent flooding the planet.

It began as a lark. For the past few months, I’ve been writing installments of a serialized science fiction novel about a world in which the oceans have risen nearly 80 meters and most of the human race now lives at sea. As the characters in my story ventured closer to shore, I realized I needed a simple way to visualize what that world would look like. I took to Google Earth and Inkscape—both free, readily available software packages—and simulated 80 meters of sea level rise. The results were stark, post-apocalyptic images of city skylines, submerged. Los Angeles was completely inundated south of the financial district. In D.C, only the Washington Monument rose above the encroaching Potomac. Telegraph Hill was an island in the expanded San Francisco Bay. North Carolina was a warm, shallow sea stretching from the Outer Banks to Rocky Mount. Florida was gone.

Want to read more? Check out my article at Zócalo Public Square: Why I Drowned L.A. and the World

How to #DrownYourTown: a step by step guide to modeling sea level rise in Google Earth

We’ve reached the point in the program where requests for #DrownYourTown are coming in faster than I can process. That’s great! It means people are really connecting with the #DrownYourTown hashtag as a way to bring the concept (if not the specific details) of sea level rise home. The response has been greater than I ever imagined!

So, rather than leave people high and dry (we wouldn’t want that, would we), here is a step by step guide to simulating sea level rise anywhere in the world using Google Earth and a little geographic wizardry. The best part? It can all be done with completely free software.

1. Download Google Earth — you can find it here. Take some time to play around with it. Google packed this free package with some awesome features.

Read More

#DrownYourTown: Exploring Sea Level Rise through real-time, interactive, GIS modeling

UPDATE: These posts, and the hashtag are getting a lot of attention, so I’d like to reiterate, Caveat Tweetor (twitter beware) — these models are being generated on the fly as request come in. They are not validated and there are many variables that influence sea level rise which are not taken into account. This is a fun way to visualize potential sea level rise but it would be inadvisable to use it for real estate speculation. 

This afternoon, I took to twitter to try out a novel outreach initiative — getting people to think about sea level rise by asking them to drown their home towns. With Google Earth and a “Sea Level” image layer booted up, I was poised for 2 hours of intense map manipulation. The requests came in fast, and ranged from the expected coastal cities with a couple meters of sea level rise all the way to the radical (yes, we flooded Reno, Nevada). After 120 minutes, I had produced models at 52 locations and interacted with more than 400 people. I was also completely exhausted. Here, for your enjoyment, is the complete collection of #DrownYourTown models from the initial 2-hour marathon.

Read More

Science in the Fleet: What would your hometown look like with 80 meters Sea Level Rise

UPDATE: These posts, and the hashtag are getting a lot of attention, so I’d like to reiterate, Caveat Tweetor (twitter beware) — these models are being generated on the fly as request come in. They are not validated and there are many variables that influence sea level rise which are not taken into account. This is a fun way to visualize potential sea level rise but it would be inadvisable to use it for real estate speculation. 

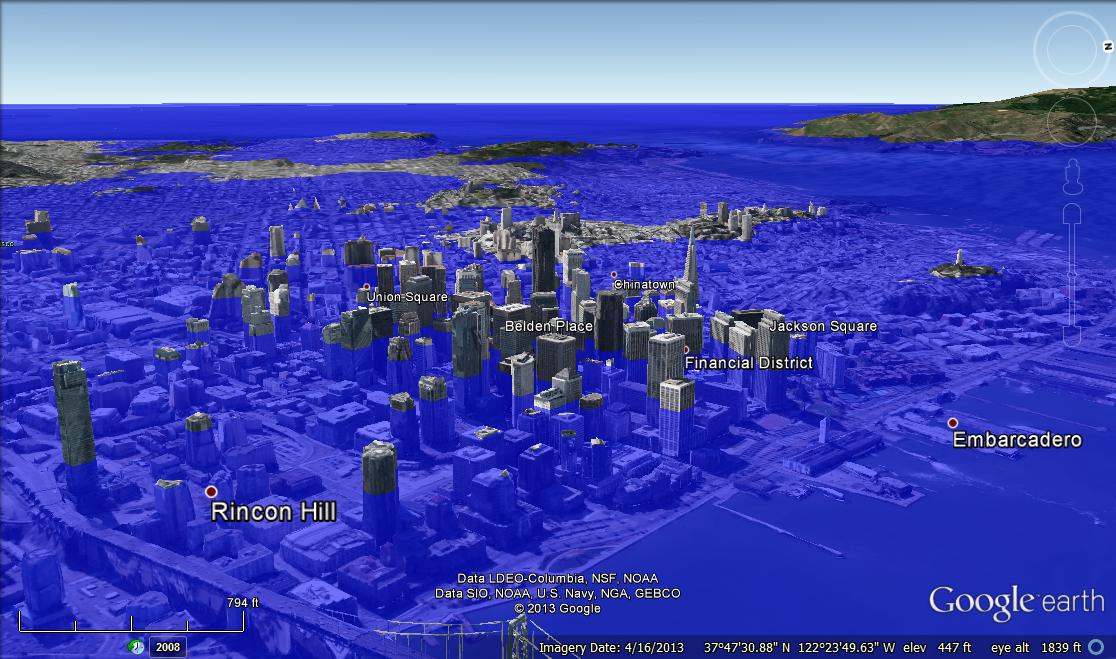
The central conceit in the world of Fleet–my dystopian maritime science fiction serial adventure–is that sea level has risen 80 meters, an extreme maximum projection under global climate change prediction (INSERT LINK TO USGS DATA HERE AFTER SHUTDOWN ENDS – UPDATE: Oh, neat, we have a federal government again. Here’s the source). Since 80 meters is pretty hard to visualize, I turned to Google Earth to help me simulate what our world would look like under those conditions, starting with my new residence in San Francisco:

FleetSanFran

San Francisco, 80 meters

Oh, but we’re not done yet.

Read More