Skip to content

Southern Fried Science

Over 15 years of ocean science and conservation online

  • Home
  • About SFS
  • Authors
  • Support SFS

How to #DrownYourTown: a step by step guide to modeling sea level rise in Google Earth

Posted on October 18, 2013November 1, 2013 By Andrew Thaler 4 Comments on How to #DrownYourTown: a step by step guide to modeling sea level rise in Google Earth
#DrownYourTown

We’ve reached the point in the program where requests for #DrownYourTown are coming in faster than I can process. That’s great! It means people are really connecting with the #DrownYourTown hashtag as a way to bring the concept (if not the specific details) of sea level rise home. The response has been greater than I ever imagined!

So, rather than leave people high and dry (we wouldn’t want that, would we), here is a step by step guide to simulating sea level rise anywhere in the world using Google Earth and a little geographic wizardry. The best part? It can all be done with completely free software.

1. Download Google Earth — you can find it here. Take some time to play around with it. Google packed this free package with some awesome features.

2. Clear the world — On the left, under the layers tab, click the box next to Primary Database to disable all layers. This give you a nice, clean world to work with.
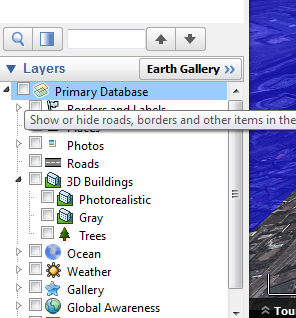
Clear the world
Clear the world

3. Make some buildings — In the Primary Database, re-enable 3D buildings. This gives you those cool 3D cityscapes that really bring the message home.
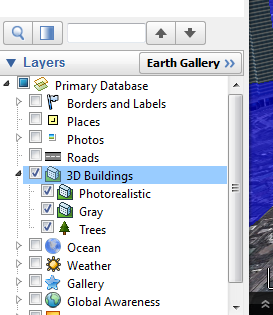
Add some buildings.
Add some buildings.

3b. Add some labels — (optional) Also in the Primary Database, re-enable Borders and Labels. This will help you navigate the world by labeling key features.

4. Make a square — Open up your favorite illustration software (I use Inkscape, but you can get along just fine with paint). Draw a perfect square with no borders and fill it entirely with blue (or brown, or green, or lava). Save it as a .jpg.

5. Create an image overlay — On the upper bar in Google Earth, click the “create image overlay” button. Name it something obvious and link it to your square.
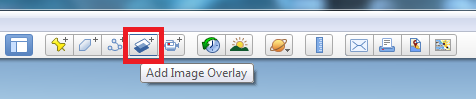
Add image overlay
Add image overlay

6. Wrap it around the world — Under the location tab, set to North 90, South -90, East 180, West -180. This will stretch and wrap your square around the world (UPDATE: some users are reporting problems inputting coordinates, try inputting 90° 0’0.00″N; 90° 0’0.00″S; 180° 0’0.00″E; 180° 0’0.00″W).

7. Set the height — Under the altitude tab, set the drop down list to “absolute” and enter your desired height of sea level rise.

8. Make it clear — On the transparency slider, slide it until you can see through your layer, otherwise you won’t be able to see beneath your simulated sea level rise. Click “Ok”.
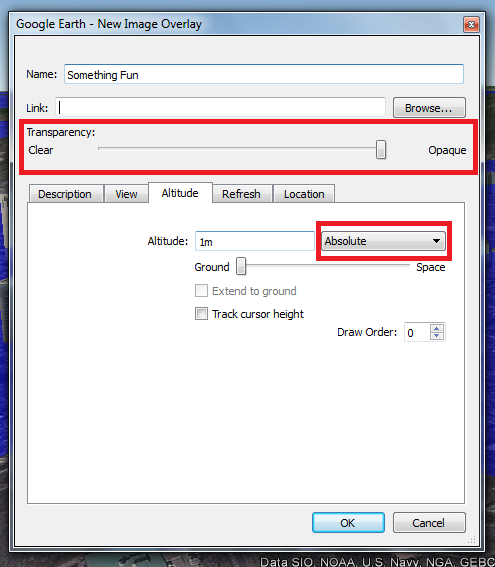
Set the altitude. Set the transparency.

9. Explore the world — Go check out your home town. Play with the movement controls in the upper right-hand corner of the map. Dragging the eye around will change the perspective so you an get down into the streets.

10. Take a picture — Click the “Save Image” button on the top toolbar.

Take a picture!
Take a picture!

11. Tweet the hashtag — Don’t forget to upload your simulated sea level rise image to twitter. Use the hashtag #DrownYourTown to share it with the world!

And there you go. You are now an official #DrownYourTown Town Drowner. Go forth and spread the word. As always, please remember, Caveat Tweetor — Twitter beware. These are not perfect models of sea level rise, they are just useful (and entertaining) visualization tools. The topology in Google Earth is not perfect (you will find places where the sea itself is higher than you sea level rise layer).

Share this:

  • Share on Bluesky (Opens in new window) Bluesky
  • Share on Facebook (Opens in new window) Facebook
  • Share on Reddit (Opens in new window) Reddit
  • Share on Threads (Opens in new window) Threads
  • Share on WhatsApp (Opens in new window) WhatsApp
  • Share on Mastodon (Opens in new window) Mastodon

Related

Tags: #drownyourtown sea level rise

Post navigation

❮ Previous Post: Welcome back, U.S. government science and environment agencies!
Next Post: CNN is airing “Blackfish” Thursday at 9. Watch with us and join the live twitter chat! ❯

You may also like

#DrownYourTown
Check out my #DrownYourTown feature at Zócalo Public Square
November 1, 2013
arduino
Sea Leveler Update: one week of #sealevelrise
April 13, 2013
Uncategorized
Snot Bots for whale health, critical dolphins, lobster considerations, and more! Monday Morning Salvage: January 15, 2018.
January 15, 2018
#DrownYourTown
#DrownYourTown: Exploring Sea Level Rise through real-time, interactive, GIS modeling
October 16, 2013

4 thoughts on “How to #DrownYourTown: a step by step guide to modeling sea level rise in Google Earth”

  1. Dr. M says:
    October 18, 2013 at 12:36 pm

    Did it! So awesome. Thanks for the instructions!

  2. ChrisC says:
    October 23, 2013 at 11:37 am

    This is so much fun.

  3. Sam W says:
    October 23, 2013 at 11:51 am

    Not able to enter South -90 West -180 in Google Earth Mac, or minus signs . Another way to make it work? Very useful and I want to make this work as NH coastline is facing sea level rise with big implications

  4. Andrew David Thaler says:
    October 23, 2013 at 12:22 pm

    Hi Sam,

    You can also enter the full coordinates – 90° 0’0.00″N, 90° 0’0.00″S, 180° 0’0.00″E, 180° 0’0.00″W.

Comments are closed.

Popular Posts

Why the new Trump order to shoot wolves is both illegal and a dreadful precedent for endangered speciesWhy the new Trump order to shoot wolves is both illegal and a dreadful precedent for endangered speciesSeptember 5, 2026Ali Gaster
5 things you need to know about the proposed European Union shark finning ban, including how you can helpSeptember 17, 2012David Shiffman
Severely injured great white shark found, are scientists responsible?Severely injured great white shark found, are scientists responsible?March 29, 2011David Shiffman
5 things I learned helping to reassess the global conservation status of every species of tuna and billfish5 things I learned helping to reassess the global conservation status of every species of tuna and billfishSeptember 15, 2026David Shiffman
That's not a blobfish: Deep Sea Social Media is Flooded by AI SlopThat's not a blobfish: Deep Sea Social Media is Flooded by AI SlopDecember 19, 2025Andrew Thaler
13 wrong things about sharks that conservation advocates should stop saying in 2013 (and what they should say instead)December 27, 2012David Shiffman
I can serve on your graduate thesis committee. Here’s what you can expect of me, and what I expect in return.I can serve on your graduate thesis committee. Here’s what you can expect of me, and what I expect in return.October 16, 2025David Shiffman
Getting a sense of porpoiseJanuary 20, 2009Andrew Thaler
U.S. government: shark fin bans "significantly undermine conservation and management of Federal shark fisheries"May 2, 2013David Shiffman
What is a Sand Shark?What is a Sand Shark?November 12, 2017Chuck Bangley
Subscribe to our RSS Feed for updates whenever new articles are published.

We recommend Feedly for RSS management. It's like Google Reader, except it still exists.

Southern Fried Science

  • Home
  • About SFS
  • Authors
  • Support SFS


If you enjoy Southern Fried Science, consider contributing to our Patreon campaign.

Copyright © 2026 Southern Fried Science.

Theme: Oceanly Premium by ScriptsTown